Covid-19 elimination impossible, so time for New Zealand to change direction

By Ananish Chaudhuri, Simon Thornley, Michael Jackson.

20/6/2020

877 words

The recent fiasco that allowed people to leave quarantine without testing, risking spread of Covid-19, highlights how nebulous the government’s claim of total elimination always was. The government, in projecting thousands of deaths that never eventuated, has continued with a story that the virus can be eliminated if we all play our part. The façade of a watertight border has been shattered, and the government broke its own quarantine rules. We urgently need to reconsider whether an ‘elimination at all costs’ strategy makes sense, as many other countries are moving on and opening up their borders.

Like other coronaviruses, Covid-19 is here to stay and a vaccine will be a long time coming. Studies show that respiratory viruses are ubiquitous. Over two years, in a cohort of 214 people who were sampled every week in New York, 70% had at least one positive test for a respiratory virus, with the vast majority having few symptoms of infection.

And even if we do get a vaccine, its efficacy is far from guaranteed. Vaccines against seasonal flu are often ineffective since we are often vaccinating against last year’s strain while the virus has already mutated.

Vaccines need to be thoroughly tested before they are offered to the populace. The usual process is to go through three phases of clinical trials. At present, only one vaccine is in phase 2, where safety and dose information is tested in a large group. The critical phase of testing efficacy (phase 3) is the most time-consuming step and often takes years. With the virus now waning in many countries, demonstrating the effectiveness of the vaccine will be difficult, since exposure to the virus will be rare. The sooner we face up to this fact, the better off we will all be. Sooner or later, we will have more cases; at least ripples, if not a wave. We will need to learn to tolerate further cases.

However, based on what we know about the virus at this point, there is no reason to panic. First, contrary to what was claimed earlier, the infection fatality rate of Covid-19 is around 0.25 percent. Many people who contract the virus show few symptoms and the age distribution of fatality with the virus is similar to day-to-day life. Serological tests are telling us that a much larger proportion of the population has immunity against the virus. Even in those who test negative, a high proportion are showing other signs of immunity, through a separate cell-mediated pathway. With more of us already protected, it is harder for the virus to spread.

Second, the most at risk are the elderly, especially those who are frail with other illnesses. This does not mean that we should be willing to sacrifice our parents and grandparents. It simply means that we need to exercise greater caution around the elderly, particularly those in care homes and in hospitals. The majority of deaths with Covid-19 have been in rest homes. Conversely, this also means that we don’t need to worry too much about the young and the healthy. Children especially seem virtually immune to the disease.

Third, countries all around the world have started opening up. Slovenia has opened its border with Italy, the hardest hit country. The government of Slovenia has declared the epidemic over and is now rather prioritising economic recovery. Across Europe countries are moving to open up their borders, as their governments reassess the risk posed by the virus.

Given this, it seems bizarre that our border is still tightly closed, even with our Pacific neighbours including Cook Islands, a state that is associated with New Zealand. The Cook Islands earns 80% of its revenue from tourism mostly from New Zealanders who holiday there.

Lockdowns are not and never were a panacea. There is very little evidence that lockdowns mitigate the spread. The theory indicates that they slow cases down, rather than reduce overall numbers. Our firm lockdown will cause a significant economic misery with public debt climbing to more than 50% of our GDP in about 2 years’ time. Unemployment will increase sharply and it is well documented that higher unemployment lowers life expectancy, not to mention potential self-harm.

Current predictions are for a 15.8% drop in GDP in the second quarter of the year, suggesting that the Finance Minister’s suggestion of a 4.8% drop during the budget presentation was underestimated.

Behind the scenes, lockdowns, here and elsewhere, are causing havoc. The evidence is emerging gradually. Required tests and surgeries have been postponed and vaccinations have been delayed. Both lives and livelihoods have taken a hit. Around the world, about 80 million children have not been vaccinated leading to a sharp increase in measles, diphtheria and cholera.

It is now time to take stock. The government has broken its own rules to eliminate the virus. Simultaneously, Covid-19 is not as dangerous as it was first thought to be. Serology tests overseas clearly show that the virus has got to many more people than appreciated. We urgently need to assess our own population’s susceptibility to the virus, as we reconsider the border question. It is time for recalibration of the threat, and to prioritise flattening the economic recession curve, rather than doubling down on a fragile and myopic vision of elimination.

Stanford study reveals why COVID19 forecasts failed

…models failed when they used more speculation and theoretical assumptions and tried to predict long-term outcomes, e.g. using early SIR-based models to predict what would happen in the entire season. However, even forecasting built directly on data alone fared badly. E.g., the IHME failed to yield accurate predictions or accurate estimates of uncertainty. Even for short-term forecasting when the epidemic wave has waned, models presented confusingly diverse predictions with huge uncertainty.


…epidemic forecasting continued to thrive, perhaps because vastly erroneous predictions typically lacked serious consequences. Actually, erroneous predictions may have been even useful. A wrong, doomsday prediction may incentivize people towards better personal hygiene. Problems starts when public leaders take (wrong) predictions too seriously, considering them crystal balls without understanding their uncertainty and the assumptions made.

https://forecasters.org/blog/2020/06/14/forecasting-for-covid-19-has-failed/


Millions of accumulated years of life will be lost to Covid-19 response

[Lockdown] policies have created the greatest global economic disruption in history, with trillions of dollars of lost economic output. These financial losses have been falsely portrayed as purely economic. To the contrary, using numerous National Institutes of Health Public Access publications, Centers for Disease Control and Prevention (CDC) and Bureau of Labor Statistics data, and various actuarial tables, we calculate that these policies will cause devastating non-economic consequences that will total millions of accumulated years of life lost in the United States, far beyond what the virus itself has caused.

https://thehill.com/opinion/healthcare/499394-the-covid-19-shutdown-will-cost-americans-millions-of-years-of-life

A request for balanced analysis and reporting

Drs Michael Jackson and Simon Thornley

A recent article in a New Zealand newspaper claims that Sweden’s approach to managing the Covid pandemic means that “56,000 more people may yet die”. We believe the article is misleading because:

  1. The author assumes an ‘infection fatality proportion’ (IFP) of 1% and states it’s the “current best estimate”. This estimate is derived from seroprevalence studies from just two countries (France and Spain – both with high per capita death rates). But, the Centre for Disease Control’s (CDC) recent best estimate is 0.26% (four times lower). A summary of studies (19 May) by Professor John Ioannidis that included studies from Asia, Europe, and North and South America derived an estimate of between 0.02% to 0.40%. This mirrors the IFR provided by the Centre for Evidence-Based Medicine at Oxford University. We believe the use of a high IFP is misleading as it produces an estimate that wasn’t based on current best estimates.
  2. The author does not include any commentary about the recent identification of cross-reactive T-cells. The paper’s findings (published May 14 and before the author’s article was published) indicate between 40-60% of a population may not even be susceptible to Covid-19 due to prior exposure to other coronaviruses that cause the common cold. This has important implications, as it lowers the number of people susceptible to infection. More recently (we acknowledge after the article was published), one of the world’s most influential neuroscientists and statisticians, Professor Karl Friston (University College London) said the figure could be as high as 80%. The inclusion of this information would have allowed for the re-calculation of an estimated fatality rate and provided the reader with further information about the uncertainty of the author’s predictions.
  3. The author assumes that 60% of a population needs to be have been infected or vaccinated to achieve herd immunity. But some are calculating it at 40% based on Sweden-specific data, not generic inputs. Also, the 60% figure is based on modelling, rather than measured seroprevalence. Given the previous data about T cell immunity and cross-reactivity of other antibodies, the true population immunity is likely to be much higher than seroprevalence surveys indicate. Again, this paints a more negative picture and doesn’t present the reader with a balanced view.
  4. The author states “After completing this article, a new study has reported that the proportion of people in Stockholm with antibodies to Covid-19 is only 7.3 per 100 people”. But an internet search will tell that the 7.3% figure “reflects the state of the epidemic earlier in April”. That’s a whole month before the article was written and when the total number of deaths in Sweden was around 1000. Sweden’s Public Health Agency estimates the figure would now be about 20% but this isn’t mentioned by the author.
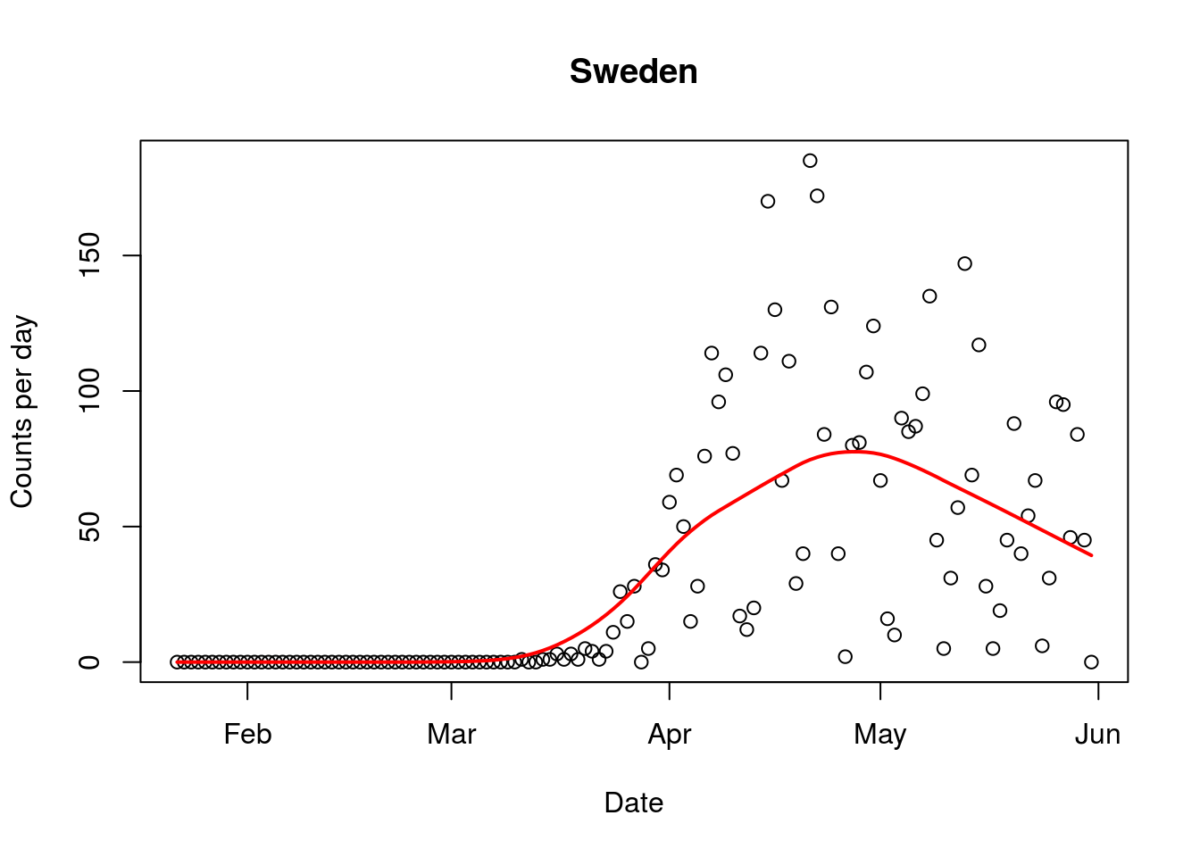
  5. The author does not attempt to consider how his prediction of 56,000 extra deaths matches actual recorded data and trends for Covid-19 in Sweden (figure). With 4,874 deaths currently, and a clear downward trend (also evident when the author published his article), the author’s prediction is unrealistic.

Figure. Covid-19 daily mortality in Sweden (16/6/2020). Line indicates trend.
  1. The author claims that Sweden’s economy hasn’t fared any better than its neighbours, despite its more relaxed approach. Again, this is misleading. While this may be true for Denmark and Norway (note Norway now say they could have achieved the same results without a lockdown), Sweden’s projected downturn (1% GDP) is less than Germany (6.5%), the Netherlands (6.8%), the EU as a whole (7.4%), Belgium (8%), France (8.2%), Croatia, (9.1%), Spain (9.4%), Italy (9.5%), Greece (9.7%) and the UK (up to 14%). For comparison, the New Zealand government is predicting a downturn of around 10%. You may also be surprised to hear Sweden’s economy actually grew in the first quarter of 2020 compared to declines across Europe. The UK’s economy, for example, contracted by 2% over the same period.

We are not, here, looking to justify of Sweden’s approach. Only time will tell if Sweden took the right one. We are simply asking that commentators present their work in a balanced, evidence-based way – one that draws the reader’s attention to the complexity and uncertainty in their projections. Figures like “60,000 deaths” are headline-grabbing but are based on incomplete and overly simplistic modelling. They are not ‘reasonable best estimates” based and clearly contradict observed trends.

Learning from new Covid-19 data

Simon Thornley

15/6/2020

Words: 670

In the response to Covid-19, it is easy to forget that our knowledge of the virus is provisional and still evolving. We have seen, for example, that the infection fatality rate, initially given as 3.4%, now with serology data has been dialled back considerably to between 0.02 to 0.40% which is in the range of severe influenza. This updated information brings an inevitable conflict with political decision making, in which actions are often justified at all costs.

We have now seen evidence of this, with the Medical Director of the Royal New Zealand College of General Practitioners, Dr Bryan Betty, stating that New Zealand was staring down the barrel of a “potential health system meltdown.” He continued: “We were literally one week away from that or we were going down a track of lockdown, which actually halted the spread of the coronavirus in New Zealand. You’ve got to remember that at that time we had exponential growth going on… [Our case numbers] were doubling every day.”

On the face of it, this sounds reasonable. We were looking down the barrel… Let’s pull out all the stops.

Several of Betty’s statements deserve scrutiny. The first is that numbers were doubling every day. They weren’t. In the days immediately before lockdown, numbers increased by 4 from 36 to 40 on the 24th of March, an 11% increase, the next day to 50 (25% increase), then level 4 was instituted. Only for one day did numbers at least double (23rd of March).

The statement that we were staring at a health system meltdown is exaggerated. During the so called “crisis”, hospitals had spare capacity. Hospitals were quiet, so quiet in fact, that specialists expressed concern about it. Intensive care units likewise. In fact, we now have the opposite problem with some primary care practitioners going broke owing to lack of demand and the costs of adapting to new service models. Patients with other conditions were clearly foregoing usual care.

The dire modelling, predicted, even with strong mitigation measures, never eventuated. If there is one thing this teaches us, it is that our understanding of the virus needs updating. The 80,000 predicted deaths are an overestimate of the observed mortality number by 3,400 times. In deciding policy responses, we desperately need to take account of the evolving nature of both the science and the available information rather than rely on outdated models.

A scientific approach involves learning from mistakes. The Norwegian Prime Minister, Erna Solberg admitted that she panicked into a decision to close schools and early childhood centres. Similarly, the Director General of Health in the Scandinavian country, Camilla Stoltenberg, stated that they could have achieved the same result by ‘not locking down’.

Here, we see both politicians and health officials learning from mistakes. Rather than being an admission of failure, it is a logical and healthy response to new information. This response contrasts strongly with some of New Zealand’s leaders.

We are rapidly learning that the threat posed by the virus is not as serious as we have been led to believe. New research shows that immunity is likely to be more widespread than we have previously appreciated. Immunity to this virus is also likely since other scientists have found cross-reactivity to other coronaviruses that cause the common cold. Many more of us are likely to have seen the virus than our case numbers indicate.

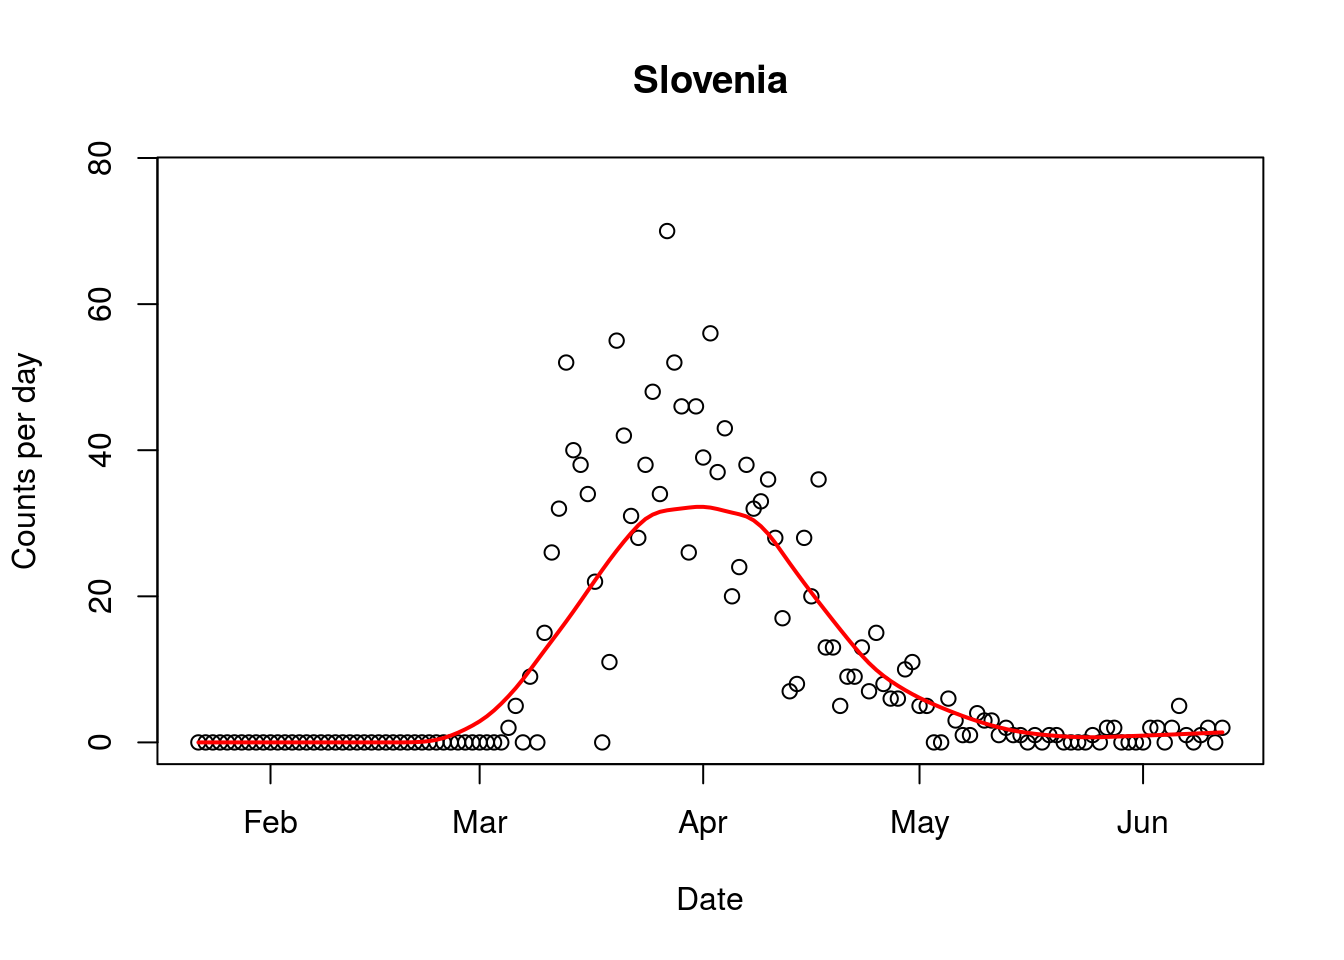
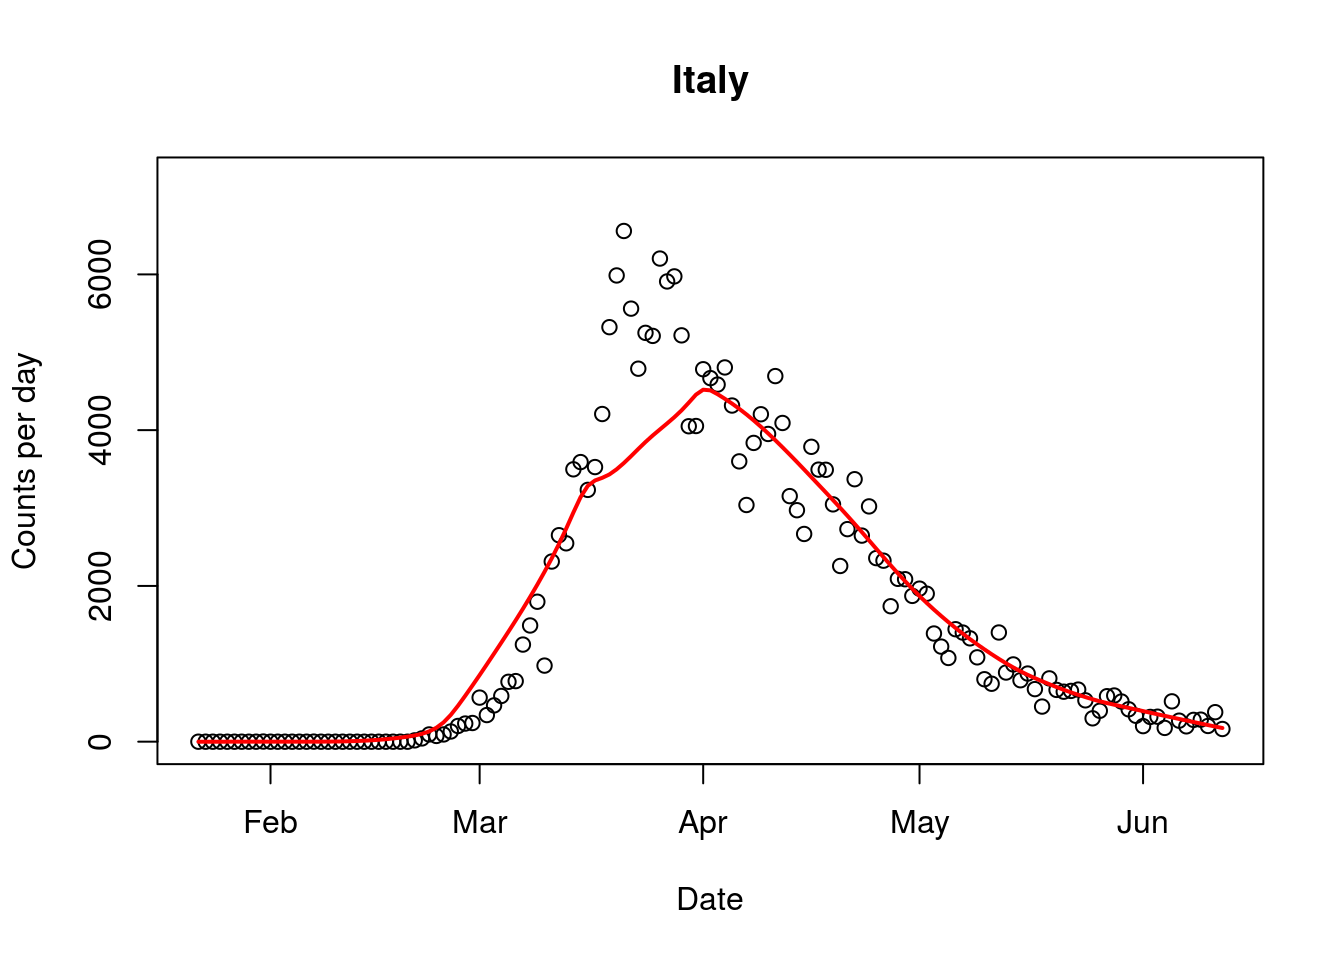
This new knowledge must lead to an update of policies for the country. We should continue to question whether it still makes sense for us to keep our borders firmly closed in the light of this new information. Serosurveys of New Zealanders would help us judge more accurately the degree of spread of the virus. If the virus has circulated to many more people than we think, and many more are protected than we previously believed, then we can have confidence to open our borders. Slovenia and Italy have already done this for several weeks and thus far they have not had second waves (figure).

Figure. Daily counts of Covid-19 cases for Slovenia and Italy, two European countries with open borders to European Union citizens.

Stanford epidemiologist says ‘no more lockdown’

John PA Ioannidis

Lockdowns were desperate, defendable choices when we knew little about covid-19. But, now that we know more, we should avoid exaggeration.21 We should carefully and gradually remove lockdown measures, with data driven feedback on bed capacity and prevalence/incidence indicators. Otherwise, prolonged lockdowns may become mass suicide.


Prolonged lockdowns fuel economic depression, creating mass unemployment. Jobless people may lose health insurance. Entire populations may witness decreased quality of life and mental health.19


Underprivileged populations and those in need are hit harder by crises. People at risk of starvation worldwide have already exceeded one billion.20 We are risking increased suicides, domestic violence, and child abuse. Malaise and societal disintegration may also advance, with chaotic consequences such as riots and wars.

https://www.bmj.com/content/369/bmj.m1924


Did the Cyprus lockdown make a difference? Yes – it made infections worse.

A Cypriot epidemiologist tracking the data…. says around half of people infected in Cyprus may have contracted the virus while indoors.


Dr Elpidoforos Soteriades, who got his degree in epidemiology at Harvard, told the Sunday Mail: “In the case of population lockdown, people were forced to stay at home. However, once the virus was already spreading within the community, lockdown was literally forcing healthy individuals to stay in close contact with relatives that might have been exposed to the virus and were potentially spreading the virus at home.”

Lockdown: did it make a difference?


Covid-19 forecaster errors wrecked Govt decision-making

By Simon Thornley, Gerhard Sundborn, Ananish Chaudhuri and Michael Jackson.

It is clear now that estimates of death from the Covid-19 pandemic were exceeded by factors of hundreds, if not thousands. This sparked public and political panic and led to our government enacting one of the most stringent lockdowns in the world.  Te Pūnaha Matatini predicted 80,000 deaths even with mitigation strategies, while the University of Otago team forecast 12,600 to 33,600 deaths.  Their best possible estimate was 5,800 deaths. The models encouraged the government to enact tight control measures. Now, we are largely over the epidemic, although some of the modelers have warned of secondary waves. New Zealand now has 22 ‘official’ Covid-19 deaths – a far cry from the forecast doom and gloom, with at least a 263 fold over estimate at this point. A recent article about Sweden followed suit, predicting a total of 60,000 deaths for that country, and decrying its decision not to lockdown.

How was it possible for these forecasts to be so erroneous? The interesting aspect, reading the modelling now, is that the number infected under each control policy scenario, including lockdown, was about the same. The Matatini group described 89% of the population being ultimately infected under even the most stringent strategy. The moment the handbrake was let off, another outbreak would occur. However, in the paper, the modellers themselves questioned the effect of lockdowns. They wrote:  “In other countries, including those that have instigating (sic.) major lockdowns such as Italy, there is as yet insufficient evidence that this has reduced [the epidemic]”. They then stated that “successful mitigation requires periods of these intensive control measures to be continued for up to 2.5 years before the population acquires a sufficient level of herd immunity.” The conclusion was that lockdowns were buying time for vaccination and learning from other countries. The modelling that justified the lockdowns was itself clearly stating that such policies were far from a panacea.

Models incorporated lockdown measures yet still predicted thousands of deaths. Critics will say that the lockdown is precisely why the models were so inaccurate. We were saved from catastrophe. Several lines of consistent statistical evidence does not, however, support this idea. US States that did not lockdown report lower Covid-19 cases and death rates on average than States that enforced heavier restrictions. Time trends in Europe show that lockdowns prolonged the recovery from the epidemic after these policies were enforced. Closer to home, it is clear that cumulative per capita cases and deaths of Covid-19 are lower for Australia than for New Zealand despite more relaxed restrictions over the Tasman.

The major factors behind these erroneous models include: (1) an overestimate of the infection fatality rate, and (2) a reciprocal underestimate of the immunity of the population.  Mathematical models of infections project the assumptions of the modellers into the future. They are mathematically elegant, but also based on many untested assumptions. Models assume a far greater degree of certainty than is true in reality.

The models used are built for infections which declare themselves, like measles. Covid-19 is different, it produces high rates of infections in people who feel well. Measles primarily affects young children who are unlikely to die from other causes. Covid-19, on the other hand, has shown to be most vicious at the other end of the age spectrum, specifically causing death most frequently in people at a mean age very similar to our life expectancy, about 82 years. This is curious, as it strongly suggests that the virus does not shorten life, since our life expectancy, or average lifespan, is similar with or without the virus on board. There is little mention of this in the Matatini document, and it is relegated to the appendix of the University of Otago report. Instead the Otago group talk of deaths of the magnitude seen in World War I. Given the age differences of deaths in World War I (mean about 27 years), compared to Covid-19, this must surely be classed as exaggeration.

Neither modelling team attempted to quantify loss of life in terms of ‘years of life lost’ (YLL), a standard epidemiological technique for comparing disease burden. Such statistics would have produced a totally different picture than headline death tallies, portrayed simplistically by the media. YLL is the sum of the differences between age at death and median life expectancy and weights death in the young higher than deaths in the old. Since Covid-19 deaths occurred at an average age in the 80s, this method of measurement would have produced a much less striking picture than the less sophisticated count that values infant and nonagenarian mortality as equivalent. Years of life lost from Covid-19 are extremely low, and pale in comparison to other risks to health, such as cardiovascular disease, diabetes and cancer.

As in the case of swine flu, antibody tests of the virus, are dialling down the infection fatality rate, to a range similar to influenza (0.03% to 0.5%). This contrasts from the genetic test evidence used by some commentators. This cuts down the dire predictions for Sweden by a large ratio. Since even people without antibodies have evidence of seeing the virus, the true infection fatality ratios are likely to be even lower than those adjusted for antibody tests alone. It is now clear that the dire prediction is very unlikely to be correct, since Sweden is now well into the downward slide of its epidemic curve for Covid-19 deaths (figure). The value of observed data over modelled predictions is demonstrated here.

Figure1 (above). Epidemic curve of Covid-19 deaths in Sweden (1/June/2020). Line represents average trend.

Related to the immunity tests, a strong, and very questionable assumption of the modelling is that we are all, as a population, susceptible to the ‘novel’ virus. Since from early on in the epidemic, it was clear that infection was more likely in the elderly, this was unlikely to be so. Recent evidence from immunologists strongly indicate cross-reactivity between “common cold” coronaviruses and SARS-CoV-2, which was present in at least 30% of people that don’t show other evidence of having seen the disease before. This theory is supported by a study that showed that 34% of a sample of healthy blood donors who did not have antibodies, instead had other evidence of immunity, with reactive T cells to the virus. Also, the finding of test-positive samples in France well before the epidemic ‘officially’ occurred, dents the ‘we are all sitting ducks’ theory.

In trying to make sense of these erroneous predictions we have to ask how this happened? We believe two basic features of the human psyche have been at work. The first of these is loss aversion: the desire to avoid losses that are right in front of us even if it means larger losses elsewhere or further down the road. The second is confirmation bias: that is the tendency to look for evidence that confirms one’s pre-supposition and discounts evidence that calls those beliefs into question. Of course, the 24-hour news-cycle, the cacophony of social media, the need for eyeballs, clicks, likes, tweets and retweets exacerbates these matters, since apocalyptic predictions are more likely to draw attention.

Several lines of evidence give us hope, to counter pessimistic modelling. One thing the inaccuracy of the models teach us is that our understanding of the behaviour of the virus is incomplete. Better understanding should translate to more accurate prediction. Epicurves by country in Europe and many parts of Asia, along with Australia and New Zealand are showing waning epidemics with insignificant secondary peaks. These patterns strongly suggest growing immunity in these countries, despite measured low antibody prevalence in some areas. The high rates of cellular and cross immunity explains this phenomenon. China, a very densely populated country, has now widely opened up after a lockdown and had few secondary waves. Japan is the same, although they had lighter restrictions. The sustained low number of cases when the curve falls strongly indicates that we can safely return to normality much more rapidly than was thought possible.


Norway officially concludes that its lockdown was not necessary

the Norwegian public health authority has published a report with a striking conclusion: the virus was never spreading as fast as had been feared and was already on the way out when lockdown was ordered.

“It looks as if the effective reproduction rate had already dropped to around 1.1 when the most comprehensive measures were implemented on 12 March…”

https://www.spectator.co.uk/article/norway-health-chief-lockdown-was-not-needed-to-tame-covid

Video: epidemiologist’s take on Covid-19

Dr. Simon Thornley

  • Deaths due to coronavirus have been exaggerated
  • Mean age of death – 80 years old